March 2023: Future of bus in the spotlight
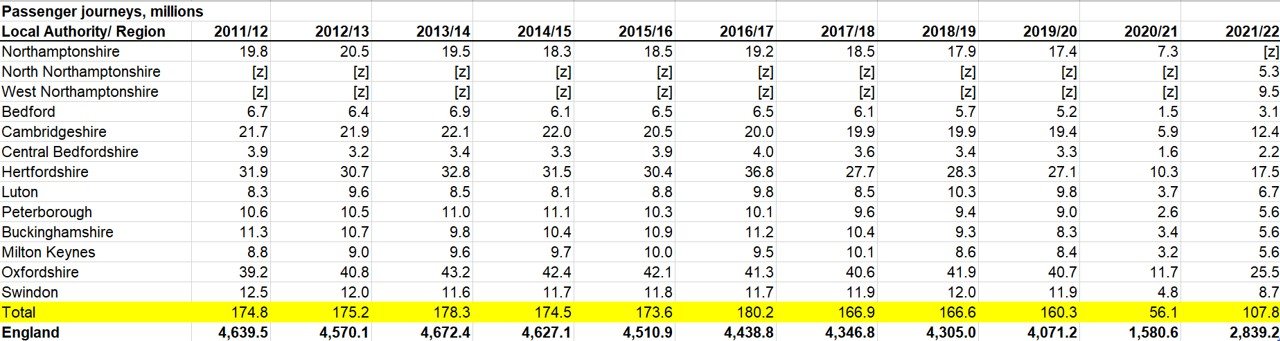
Data released in February shows that bus passenger numbers across EEH in 2021/22 were 33% down on pre-pandemic levels, compared to 30% across England.
Over the last ten years, passenger numbers have fallen by nearly 40%, matching the average across England.
The future of bus was a major item at our Strategic Transport Leadership Board on 3 March. Members heard about work EEH is already carrying out to support local authorities plan bus travel and discussed the significant challenges faced by the sector. EEH is now planning to bring together experts from across the bus sector, providing the insight to allow our Board to explore a potential course of action.
The Board also heard that a survey commissioned by EEH of 7,002 people from across all parts of the EEH region provides optimism over the potential to increase bus patronage, including among younger people, should the right levels of service be provided.
Uncompetitive journey times (particularly when compared to other modes) was the biggest reason why people were put off from travelling by bus. The cost of fares was another important factor consistent across age groups and income levels, while frequency, convenience/ availability of routes, reliability and comfort were also important.
While responses were broadly consistent amongst gender, income level and location, there were some marked differences in attitudes between people of different ages.
Factors such as information, crowding, ticketing and availability of nearby bus stops were considerably more important to people under the age of 45.
The survey also suggested that there was an appetite, particularly amongst younger people, to use buses more if the service offering improved. Only 5% of under 45s said ‘nothing’ would encourage them to use buses more, compared to 11% of those aged 45-54 and 20% of over 55s.
75% of respondents said they would support integrated ticketing, with more than half saying they planned to make a multimodal journey by public transport in the next year.

January 2023 edition
New data shows the most congested places in the Heartland
Fourteen towns and cities in the Heartland are ranked in transport analysts Inrix's top 100 most congested places in the UK.
The most congested place in the region was Cambridge, ranked as 15th in the UK and 82nd globally, where traffic jams were said to have cost drivers an average of 65 hours during 2022 (compared to if they had been driving in freeflow conditions). London was named the most congested city in the world with 156 hours lost.
According to Inrix, the second most congested place in the Heartland was Luton, followed by ‘Hertford Harlow’, Aylesbury and Northampton.
Data for individual areas are available on the Inrix website

December 2022 edition
Rail station usage reaches 60% of pre-pandemic levels
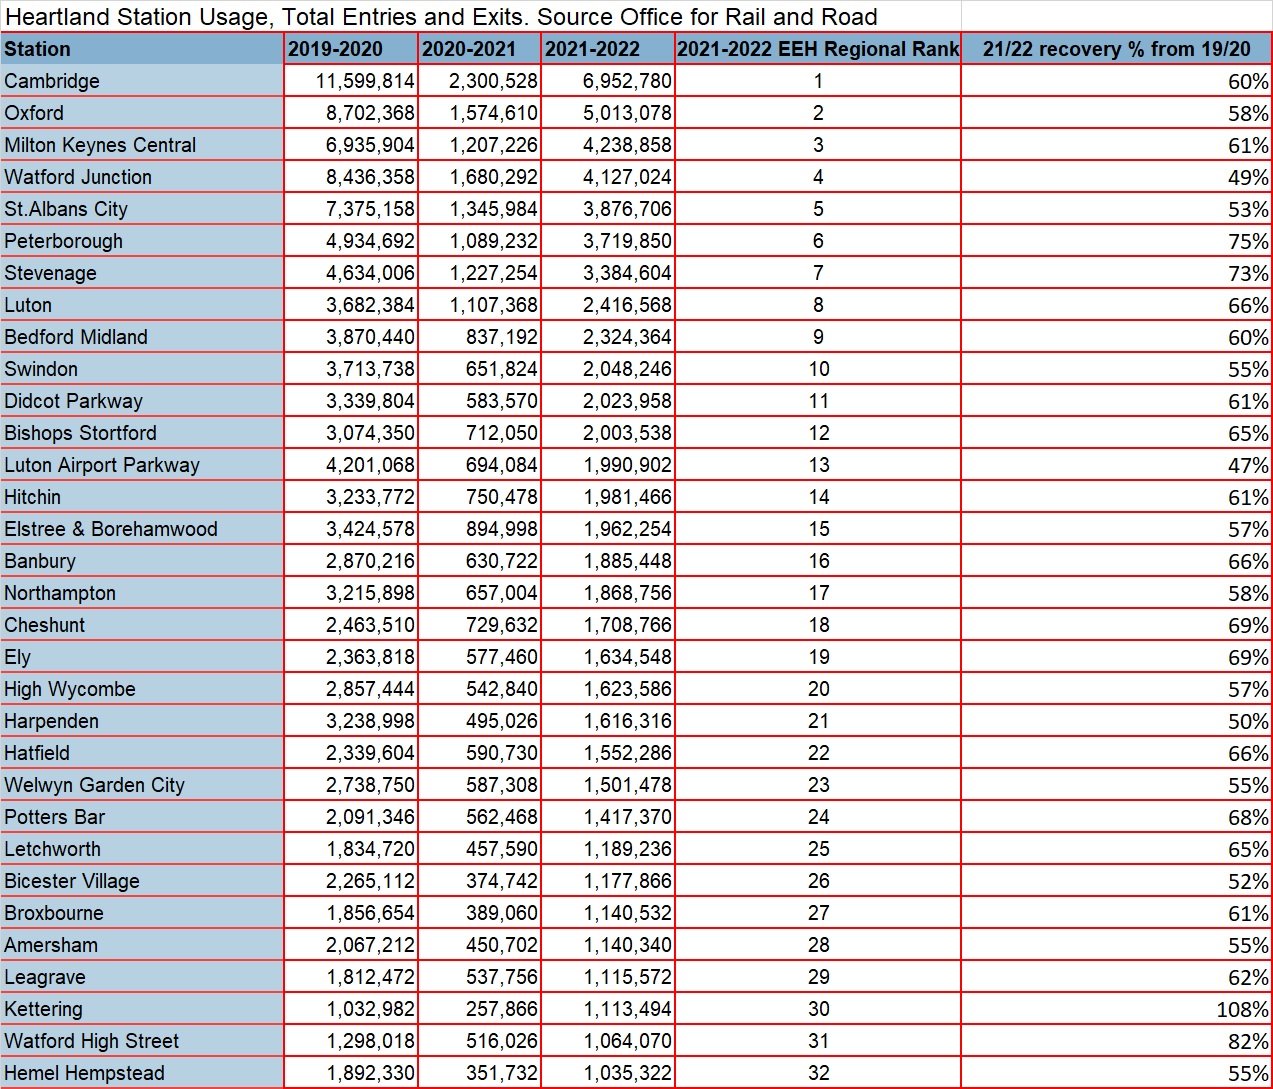
New data from the Office for Road and Rail shows that Cambridge, Oxford and Milton Keynes were the Heartland’s busiest stations in 2021/22, while entries and exits at stations across the region have recovered to an average of 60% of pre-pandemic levels.
There were 101 million entries and exits at Heartland stations in 2021-2022 compared to 36 million in 2020/21 and 169 million 2019-2020.
The number of stations in the Heartland reaching more than one million users increased from just eight in 2020/21 to 32 in 2021/22, however still short of the 51 stations recorded in 2019/20.
The stations in the Heartland which had the most entries and exits last year were Cambridge (6,952,780); Oxford (5,013,078); Milton Keynes Central (4,238,858); Watford Junction (4,127,024); and St Albans City (3,876,706). Milton Keynes Central has risen to third in the region from fifth in 2019/20 and sixth in 2020/21.
While the Heartland's overall recovery rate of 60% is broadly in line with the national picture, there were a number of stations in our region whose strong recoveries bucked the trend.
Kettering's entries and exits actually rose 10% from 2019/20 to 1.1 million in 2021/22, reflecting the May 2021 changes to EMR electric and inter-city services.
Strong recoveries at other stations with more than one millions exits and entries included:
- Watford High Street with 82% of pre-Covid levels
- Peterborough with 75%
- Stevenage with 73%
- Ely and Cheshunt with 69%
- Potters Bar with 68%
- Hatfield, Luton and Banbury with 66%
Stations with less than one million entries and exits with noteworthy levels of recovery included Stewartby (106%); Corby (99%); Iver (95%); Taplow (86%); Kingham (85%); Sandy (78%); Cambridge North (77%); Carpenders Park (75%) and Waterbeach (70%).
Soham in Cambridgeshire was Britain's only new station to open during 2021/22. It recorded 14,196 entries and exits over its first three and a half months from December 2021 to March 2022.
The most used station in Britain last year was London Waterloo with an estimated 41.4 million entries and exits, a decrease of 52% compared with 2019-2020.
See below the table of statistics for the stations reaching more than one million journeys.
Click here or see the file below for full data set for journeys in our region.